
Launch in Days, Not Weeks
Professional one-page website. Only a few slots left this month
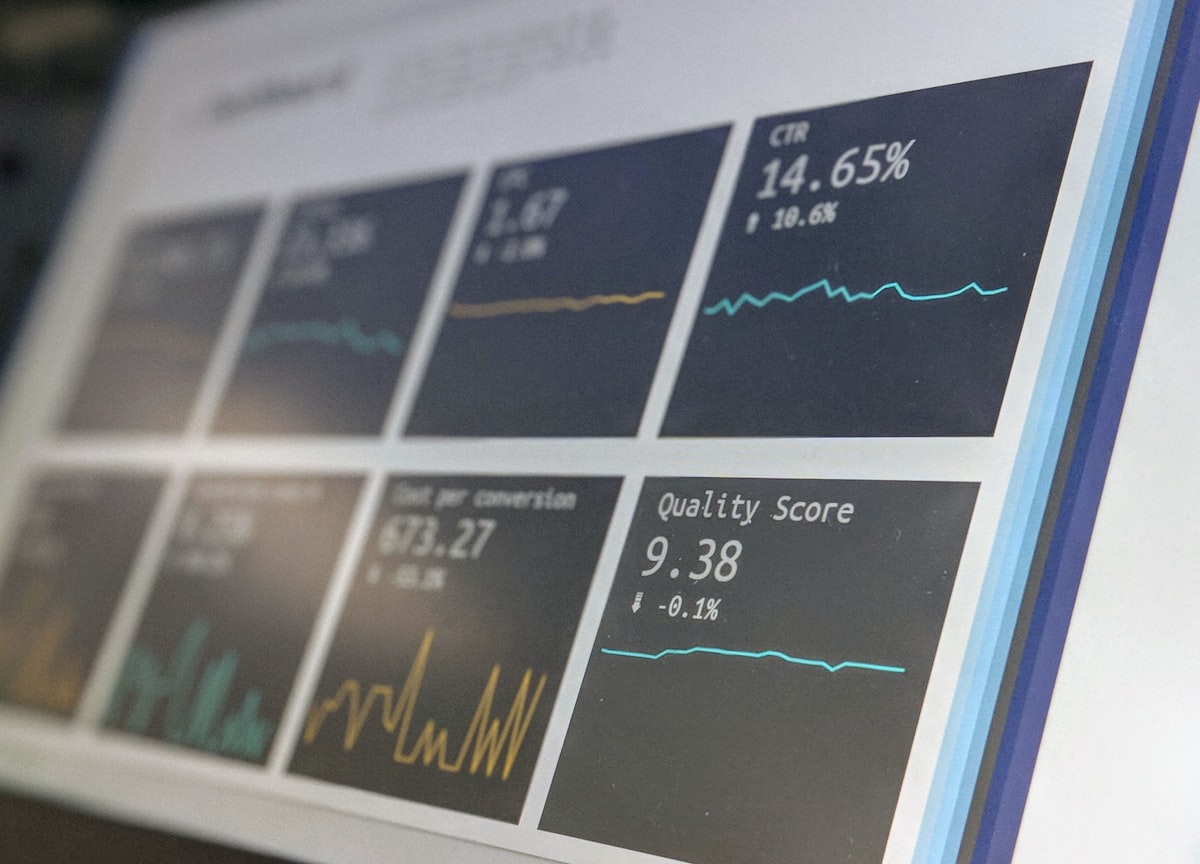
Your team spends two to three days each month pulling data from multiple platforms, building charts, writing commentary, and formatting reports for clients. That is automation’s sweet spot: repetitive, data-driven, deadline-based, and soul-crushing for talented people. Automated client reporting fixes it, and the time savings are bigger than most agency owners expect.
Research from marketing automation vendors puts the average agency at roughly 11 hours per client per month on reporting, with cross-platform data aggregation alone eating over half that time (see Sources below). For an agency with 20 active clients, that is close to a full-time role that produces nothing clients actually pay for, reports don’t win new business, they just prove the work already done was worth it.
Automated client reporting is not one tool: it is a pipeline with five stages, and each stage can be automated independently.
Most reporting tools on the market stop at step 3. Charts are the easy part. The narrative is where client trust is built or lost, and it’s the step agencies still do by hand at 11pm the night before a client call.
The foundation of automated reporting is API integration, a scheduled, authenticated connection that pulls data directly from the platform rather than relying on someone exporting a CSV.
Common sources worth connecting first:
Set these to pull on a schedule (nightly is common) so the data feeding your reports is never more than a day old, and no one is manually refreshing dashboards on report day.
Charts tell a client what happened. They rarely explain why, and they never tell a busy founder what to do next. This is where AI earns its place in the pipeline: interpreting the aggregated data, flagging anomalies (a conversion rate that dropped 40% week-on-week, an ad set that suddenly stopped spending), and drafting a plain-English summary a human reviews before it goes out.
Done well, this looks less like a robot summarising numbers and more like an account manager who read the data closely, because, functionally, that’s what it’s doing. The output still needs a human pass. AI narrative generation drafts; it should never be the last set of eyes on a client-facing document.
Once the narrative is drafted, formatting and delivery are the easiest parts of the pipeline to automate fully:
This is also where a hosted CMS matters if reports live inside a client-facing portal on your website. Fernside CMS gives clients a controlled space to log in and view their own reporting without you manually emailing PDFs every month.
Automation removes the grunt work, not the judgement. Build a review step into the pipeline, not around it:
This is roughly the same governance model that works for automated email follow-ups or CRM automation workflows, automate the repetitive middle, keep a human on quality control at both ends. It’s the same pattern behind client onboarding automation too: structure the routine steps, keep judgement where it matters.
Time it yourself before changing anything. Pull your last three client reports and clock how long each one took, start to finish, data pull, chart building, commentary, formatting, sending. That baseline is the number automation needs to beat, and it’s usually higher than people guess, because reporting time is scattered across a week rather than logged as one task.
Industry estimates put full pipeline automation at cutting report time by roughly 80 to 97%, largely because data aggregation, the slowest manual step, disappears entirely. Even a conservative outcome (say, 60% time saved) on 11 hours per client per month adds up fast across a client roster of any size.
Automating delivery before automating quality control. Sending a report no one reviewed is worse than sending it late.
Building one rigid template for every client. Different clients care about different metrics; a pipeline that can’t flex per client just relocates the manual work to the exception list.
Skipping the narrative step. Auto-generated charts without commentary read as an afterthought. Clients pay for the interpretation, not the data.
Treating this as a one-off build. Platforms change their APIs. A reporting pipeline needs light maintenance, the same way connecting business tools generally does, not a retainer, but occasional ticketed fixes when something upstream shifts.
If reporting is quietly eating two or three days a month, it’s a strong candidate for a scoped automation build rather than another dashboard subscription. Fernside Studio designs and builds these pipelines as part of our AI systems work, connecting your existing platforms, adding review checkpoints, and wiring delivery so reports go out without anyone touching a spreadsheet.
Time your next report first, that baseline makes the business case for you. Then get in touch and we’ll scope what an automated reporting pipeline would look like for your client list.